
RAT-TRACKER
PLACE: Mapping Urbanism, Columbia University
DURATION: 2 Weeks
ROLE: UI/UX Designer and Front-End Developer

OVERVIEW
The problem
New York is notorious for it’s less-than-ideal rat infestation. Many residents stumble past rats on their way to work, in the park, on the subway platform, and anywhere in between. New York’s 311 service allows residents to report complaints, include these furry critters. However, no many residents are unaware that they can report pests outside their home and help make New York cleaner.
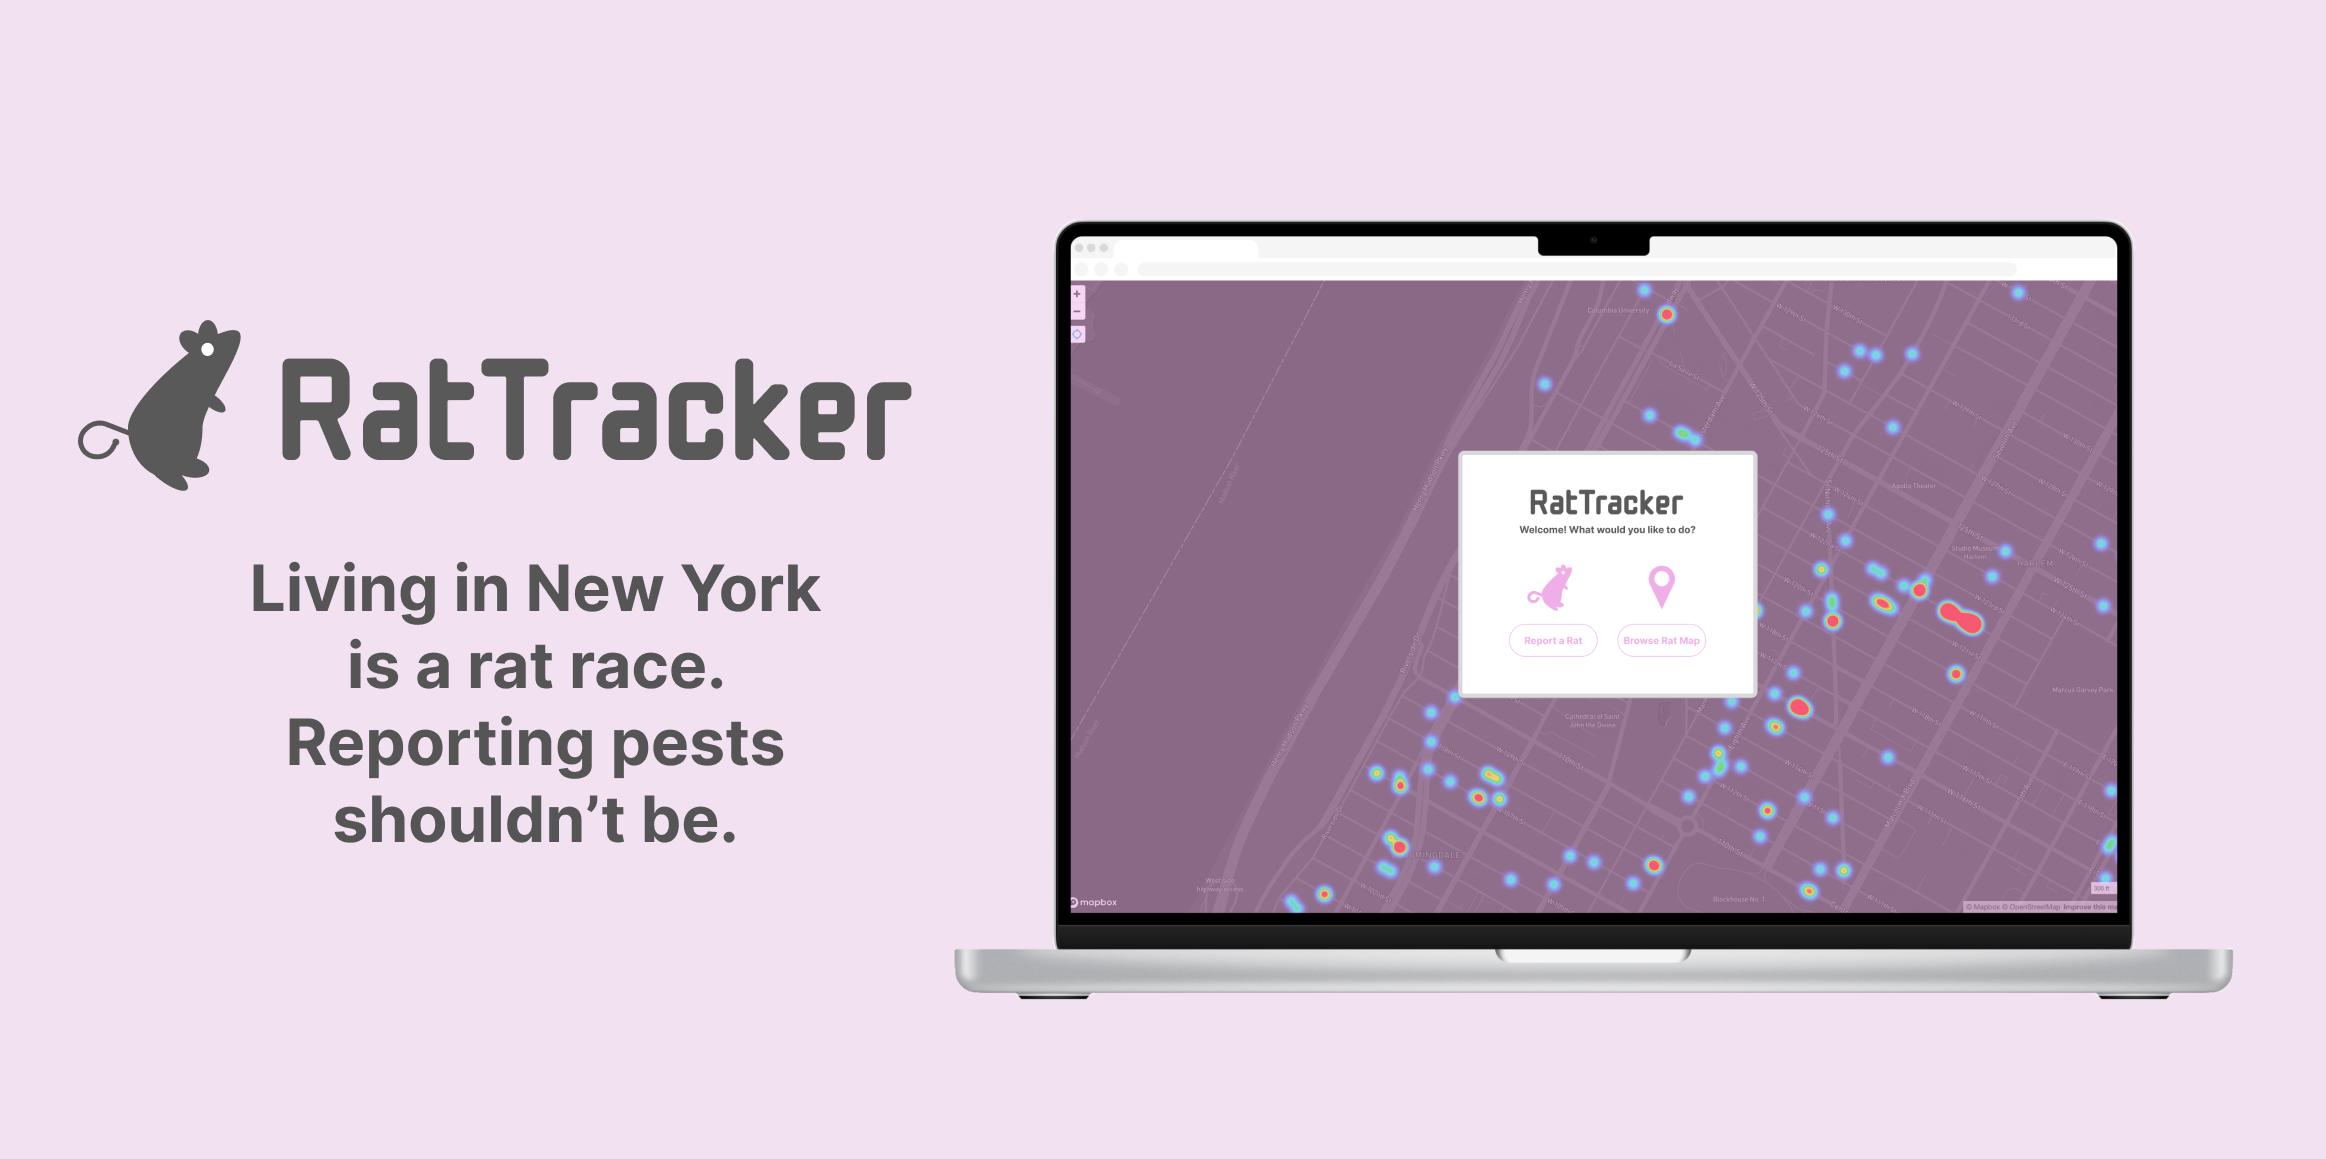
A SOLUTION FOR PUBLIC Sanitation
Rat Tracker allows New Yorkers to explore an up-to-date interactive map of the city’s pest sightings, as updated by NYC 311 data. Residents can use the platform to track and report rat sightings across the city and view trends on where pests are most present and concerning.
Visualize Live Data:
View and explore live data from NYC 311 on where are reported in the city.


2. Report a Rat:
Easily report data on a pest sighting which will be submitted to NYC Sanitation for investigation.
RESEARCH
Understanding the Problem
New York’s rodent infestation is nothing new, but our way of tackling sanitation hasn’t change all the much either. By creating an accessible platform for reporting and visualize reported rat sightings, residents are incentivize to participate in making New York more sanitary.

Union members protesting at a construction site in Manhattan in 1998.Credit: Ángel Franco/The New York Times
New Yorker’s are all too familiar with calling their building exterminator when spotting a pesky rodent. But on the street, New York’s often turn a blind eye to rats with little access or incentive to report a rat sighting.
I interviewed New Yorker locals to see what would incentivize them to report a rat and their thoughts on New York’s rodent infestation. Based on the interview responses I received, I found that many of the residents have passively accepted rats as one of the many trade-offs of living in New York.
These are some of the questions I asked:
How do you feel about New York’s rat infestation?
How often do you see a rat on your commute/daily life?
What would encourage you to report a rat sighting?
DEFINE
Empathy Maps
I generated three uniquely different types of users based on the responses I received.

Persona
After empathy mapping, the persona of the typical commuting New Yorker became more clear - I began seeing users' needs, goals, and pain points, ensuring that I was on the design decisions were reflective of real-world user sentiments.

Coming Up with Ideas and Solutions
To design for user engagement is to design for convenience.
Most residents see rats during their commute and quickly forget about it afterwards. Thus, to design for user engagement was to more design for convenience. Based on the journey map below, I made my best assumptions to try identifying these other pain points that provided opportunities for my design. One reoccurring question: How Might We design a platform that encourages New Yorkers to report rat sightings?

USER FLOW
Based on the personas, I created a feature flow to maximize user engagement and create a more intuitive user platform. The feature illustrates the steps needs to book an appointment for a house showing with an agent.

DESIGN
DESIGNING + PROTOTYPING
Sketching for Efficient Flows + Visualizations
I started to look at different UI to design the best visualization of mapping rat sightings. Mapbox, GIS data visualization tools, and data mapping websites were sources of inspiration!

Style GuiDe

TEST
ROUND OF TESTING AND IMPROVEMENTS
Reporting a rat and viewing rat reporting should be easy and engaging!
During my user testing, I reached out to multiple NYC residents and also asked for feedback on the functionality and clarity of my prototype. Overall, the feedback was very positive! Only then a few UI changes came about:
Adding a location tracker feature for finding your sighting
Adding a for reporting time/date of rat sighting
Adding a diagram to explain the density map
Final Prototype with added revisions
Although this is an up-to-date prototype, this is a continual project in collaboration with GreenThumb.
TAKEWAYS
As a front-end developer on this project, it deepened my understanding of technical development constraints versus design desires. Due to development time constraints, the version of the app included a limited number of assets. However, in future projects I would love to be involved with working with developers on advanced data visualizations.